MARKET ORDERFLOW IN IT'S SIMPLEST FORM
Simplifying orderflow data so you can find market opportunities.

We've Changed the Way You Monitor Orderflow
Compact & Concise Data Display
We found, like many others, that the conventional display of orderflow data is hard to digest, especially when you're focused on your positions. So we went to the drawing board to reimagine a way to display digestible orderflow data that doesn't require your full attention to use.
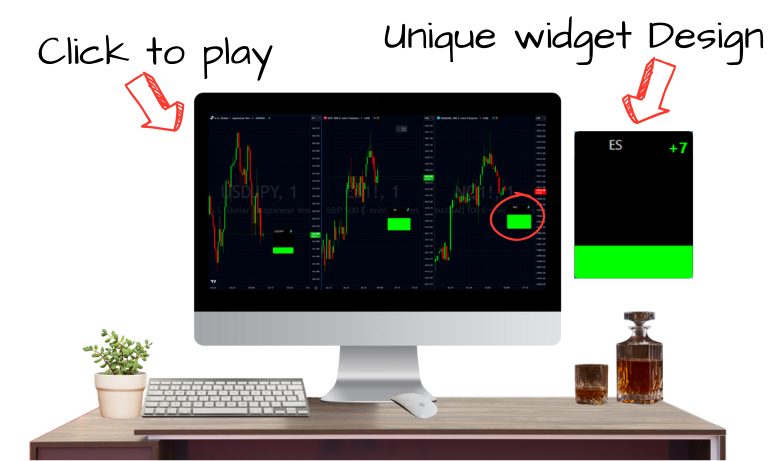
And that's when the TickStrike meter was born. We combined the use of sound with visual indication to give you the most digestible orderflow display on the market.

Here's how it works
Relative Size & Speed
Tickstrike analyzes how fast and how big people are buying and selling things, like stocks. Then, it converts that data into sound to show that information.

Why Is This so Important to You as A Trader?

Uncovering Disguised Market Orders
Some traders think big orders mean important people are buying or selling, but smart traders split their big trades into smaller ones to disguise them.
But TickStrike looks at how fast orders come in and how big they are compared to all the trading happening. This gives traders like you a better idea of what's really going on.
Designed to Be Completely Strategy Neutral
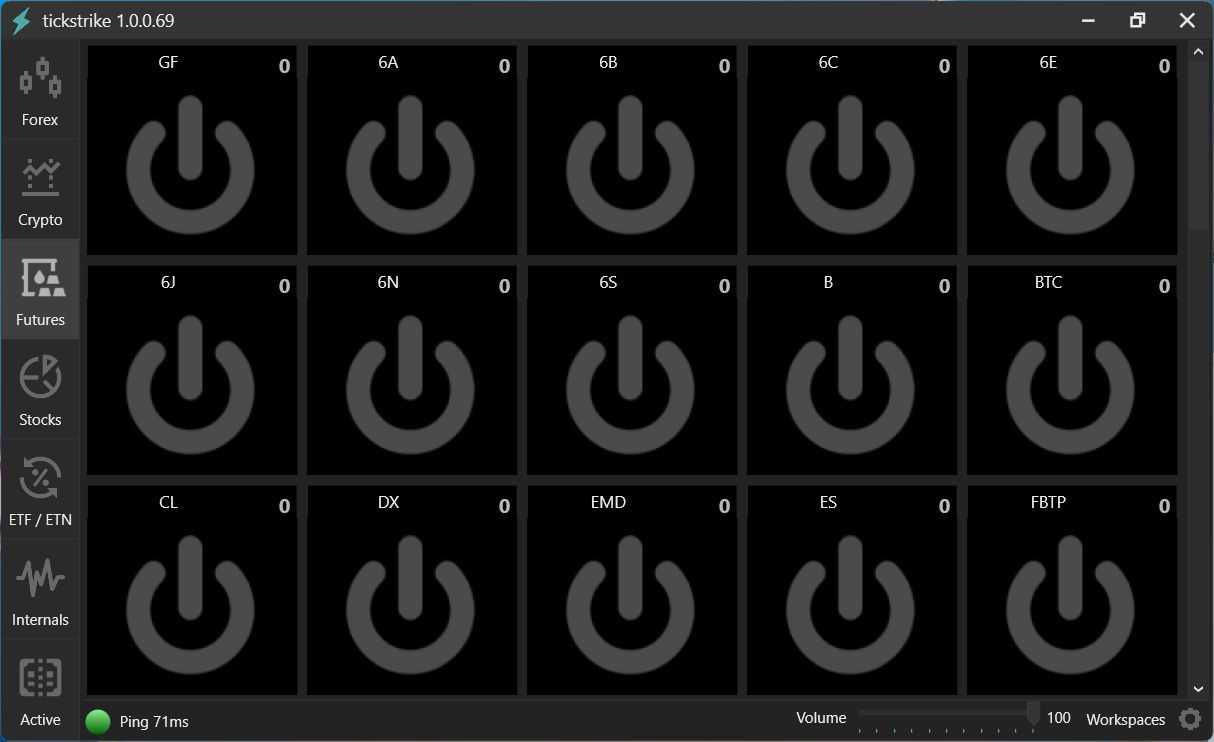
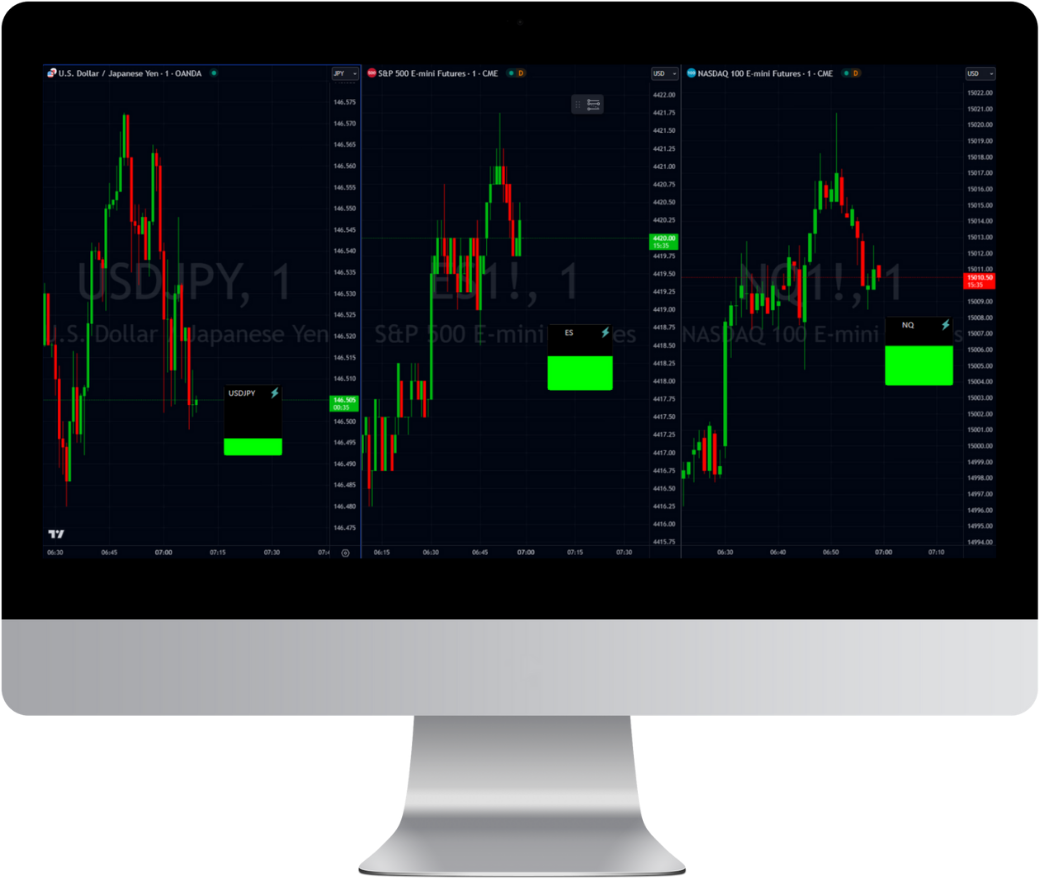
TickStrike Dashboard
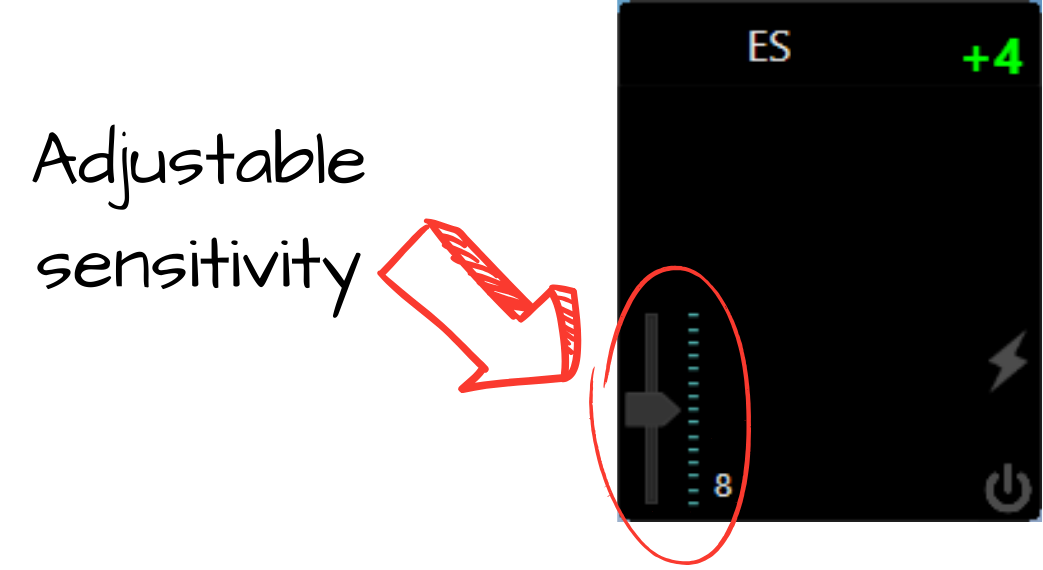
The dashboard is where you'll access all of the instruments we have to offer. You can even adjust the volume of the sound for TickStrike depending on how you like to trade, as well as the visual colours on the meter to match the candles on your charts. The workstation button will allow you to access your saved layouts, so you can easily get set up for the markets you'd like to trade that day.
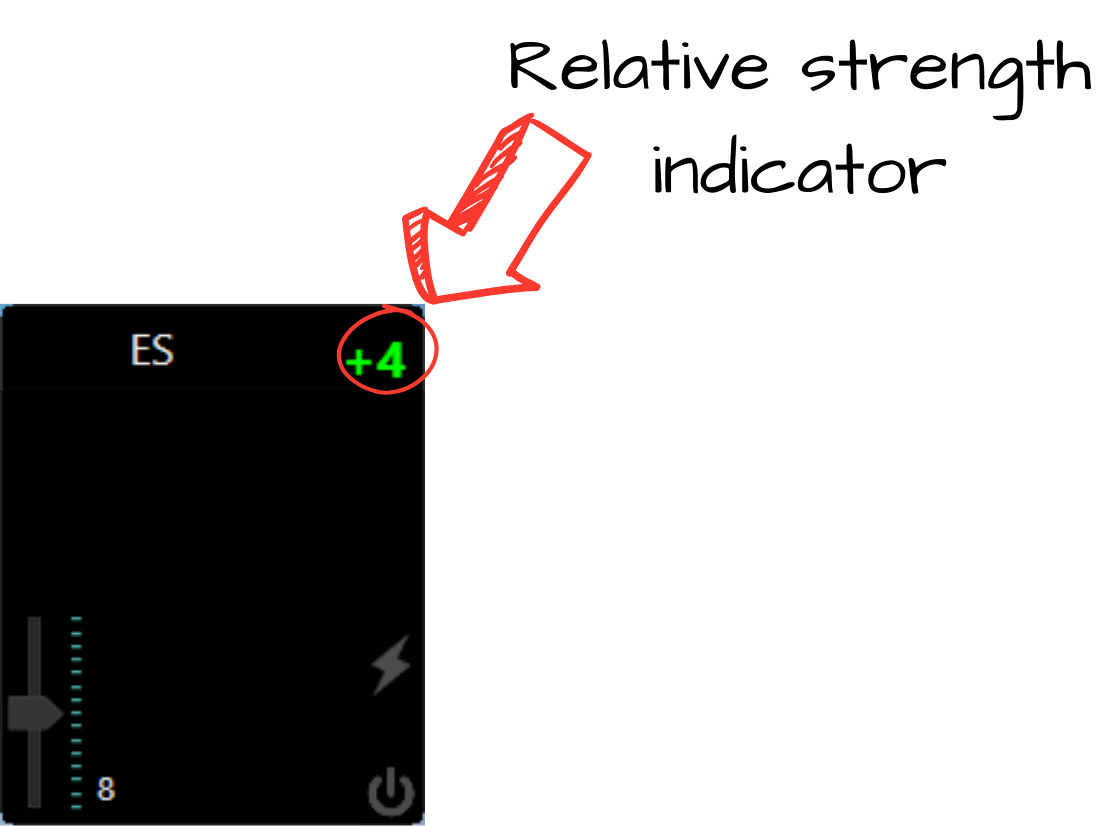
Relative Strength Indicator
This isn't an indication of the number of pips or contracts ; however, it quantifies the relative strength and speed of the contracts to allow you to understand the volatility within the market you're monitoring. This opens up the ability to trade markets which struggle for liquidity so you can find opportunities anywhere.
Here's Our Favourite Ways to Use TickStrike
No Matter What You Trade, We Cover It