

US CPI Breakdown
On Tuesday, the 13th of February, the BLS released the latest US CPI inflation print for January.
All the main CPI prints came in higher than expected.
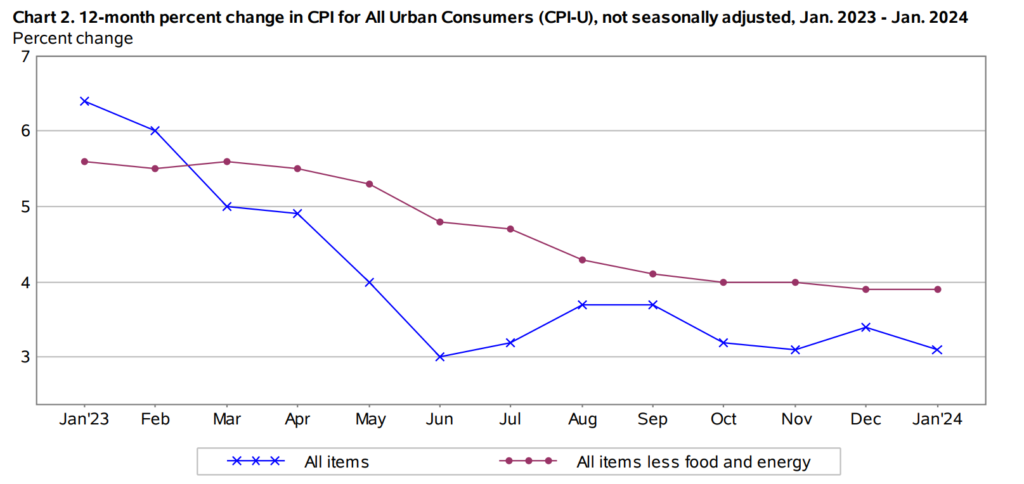
Headline YoY CPI came in at 3.1%, higher than the expected 2.9%, but still lower than the prior 3.4%
MoM also came in hot at 0.3%, from the forecast of -.2%, and the downward-revised prior of 0.2%.
Core YoY remained unchanged at 3.9%, higher than expectations of 3.7%, while the Core MoM came in at 0.4%, higher than the expected 0.3%, and up from the prior 0.3%.
Breakdown
The top positive contributors to YoY CPI were:
Transportation Services +9.5%
Shelter +6%
Services ex Energy +5.4%
Food Away from Home +5.1%
The top negative contributors to YoY CPI were:
Utility Gas Services -17.8%
Fuel Oil -14.2%
Energy Commodities -6.9%
Gasoline -6.4%

The top positive contributors to MoM CPI were:
Electricity +1.2%
Transportation Services +1%
Medical Care Servies +0.7%
Services ex Energy +0.7%
The top negative contributors to MoM CPI were:
Fuel Oil -4.5%
Used Cars/Trucks -3.4%
Gasoline -3.3%
Energy Commodities -3.2%
In January, the food index experienced a 0.4% increase, with notable rises in categories such as nonalcoholic beverages by 1.2% and fruits and vegetables by 0.4%. However, cereals and bakery products saw a decline of 0.2%. The food away from home index also rose by 0.5%, driven by increases in both full-service and limited-service meals by 0.4% and 0.6%, respectively. Over the past year, the food at home index increased by 1.2%, with nonalcoholic beverages rising by 3.4% but meats, poultry, fish, and eggs decreasing by 0.9%. Meanwhile, the food away from home index rose by 5.1%, with limited service meals notably increasing by 5.8%.
Conversely, the energy index declined by 0.9% in January, primarily due to decreases in gasoline prices by 3.3% and fuel oil by 4.5%. However, electricity prices rose by 1.2%, and natural gas increased by 2.0% during the month. Over the past 12 months, the energy index fell by 4.6%, with declines in gasoline, natural gas, and fuel oil by 6.4%, 17.8%, and 14.2%, respectively, while electricity prices rose by 3.8%.
Post Release
The markets saw a dramatic reaction to this hotter-than-expected US inflation print.
This is because, despite Fed officials saying that the road back to 2% inflation may be bumpy, the sentiment was that the disinflation trend was likely to continue.

WSJ’s Nick Timiraos, known by some as the ‘Fed whisperer’, notes:
“A March cut: Already ruled out, even more now.
Officials who wanted to see signs that disinflation was broadening beyond goods got the opposite: Goods deflation picked up, but services prices accelerated.”
This report also prompted traders of short-term US interest-rate futures to bet that the Fed will not cut rates until June and pared back their total tightening for 2024 to less than 100 bps, from over 110 bps before the inflation numbers.