US CPI Prep
On Thursday the 11th of July, at 08:30 ET, the BLS is set to release the latest US CPI report for the month of June.
Here are some views on what to expect.
Overview
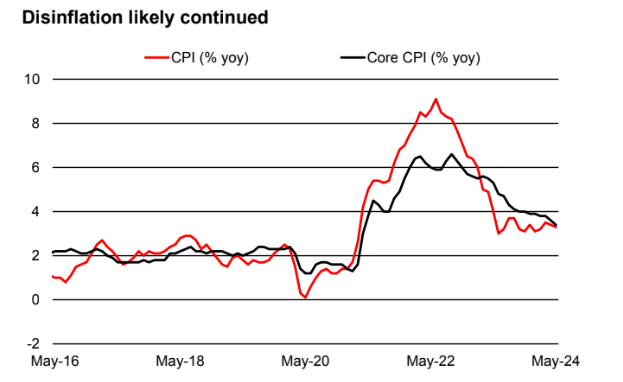
For US CPI YoY, the median forecast is 3.1%, an expected decrease from May’s 3.3%.
According to a survey of 36 qualified economists, the highest estimate is 3.5%, and the lowest is 3%.
For US CPI MoM, the median forecast is 0.1%, up modestly from the prior 0%.
The highest forecast is 0.2%, the lowest is 0%.
Here are some views from the largest investment bank forecasters

General Expectations
The Federal Reserve and its officials have stated that they need further confidence on inflation coming back towards the 2% target to gain the confidence required for Fed rate cuts.
This means that lower-than-expected inflation numbers would push forward bets on Fed rate cuts this year, which in turn, could cause strength in US stocks and bond prices, and weakness in the US dollar and US Government bond yields.
On the other hand, higher-than-expected inflation numbers could cause the opposite reaction, as this would likely feed into the ‘sticky inflation’ narrative, which could urge the Fed to keep US interest rates higher for longer, which could cause weakness in US stocks and US bond prices, and strength in the dollar and US bond yields.
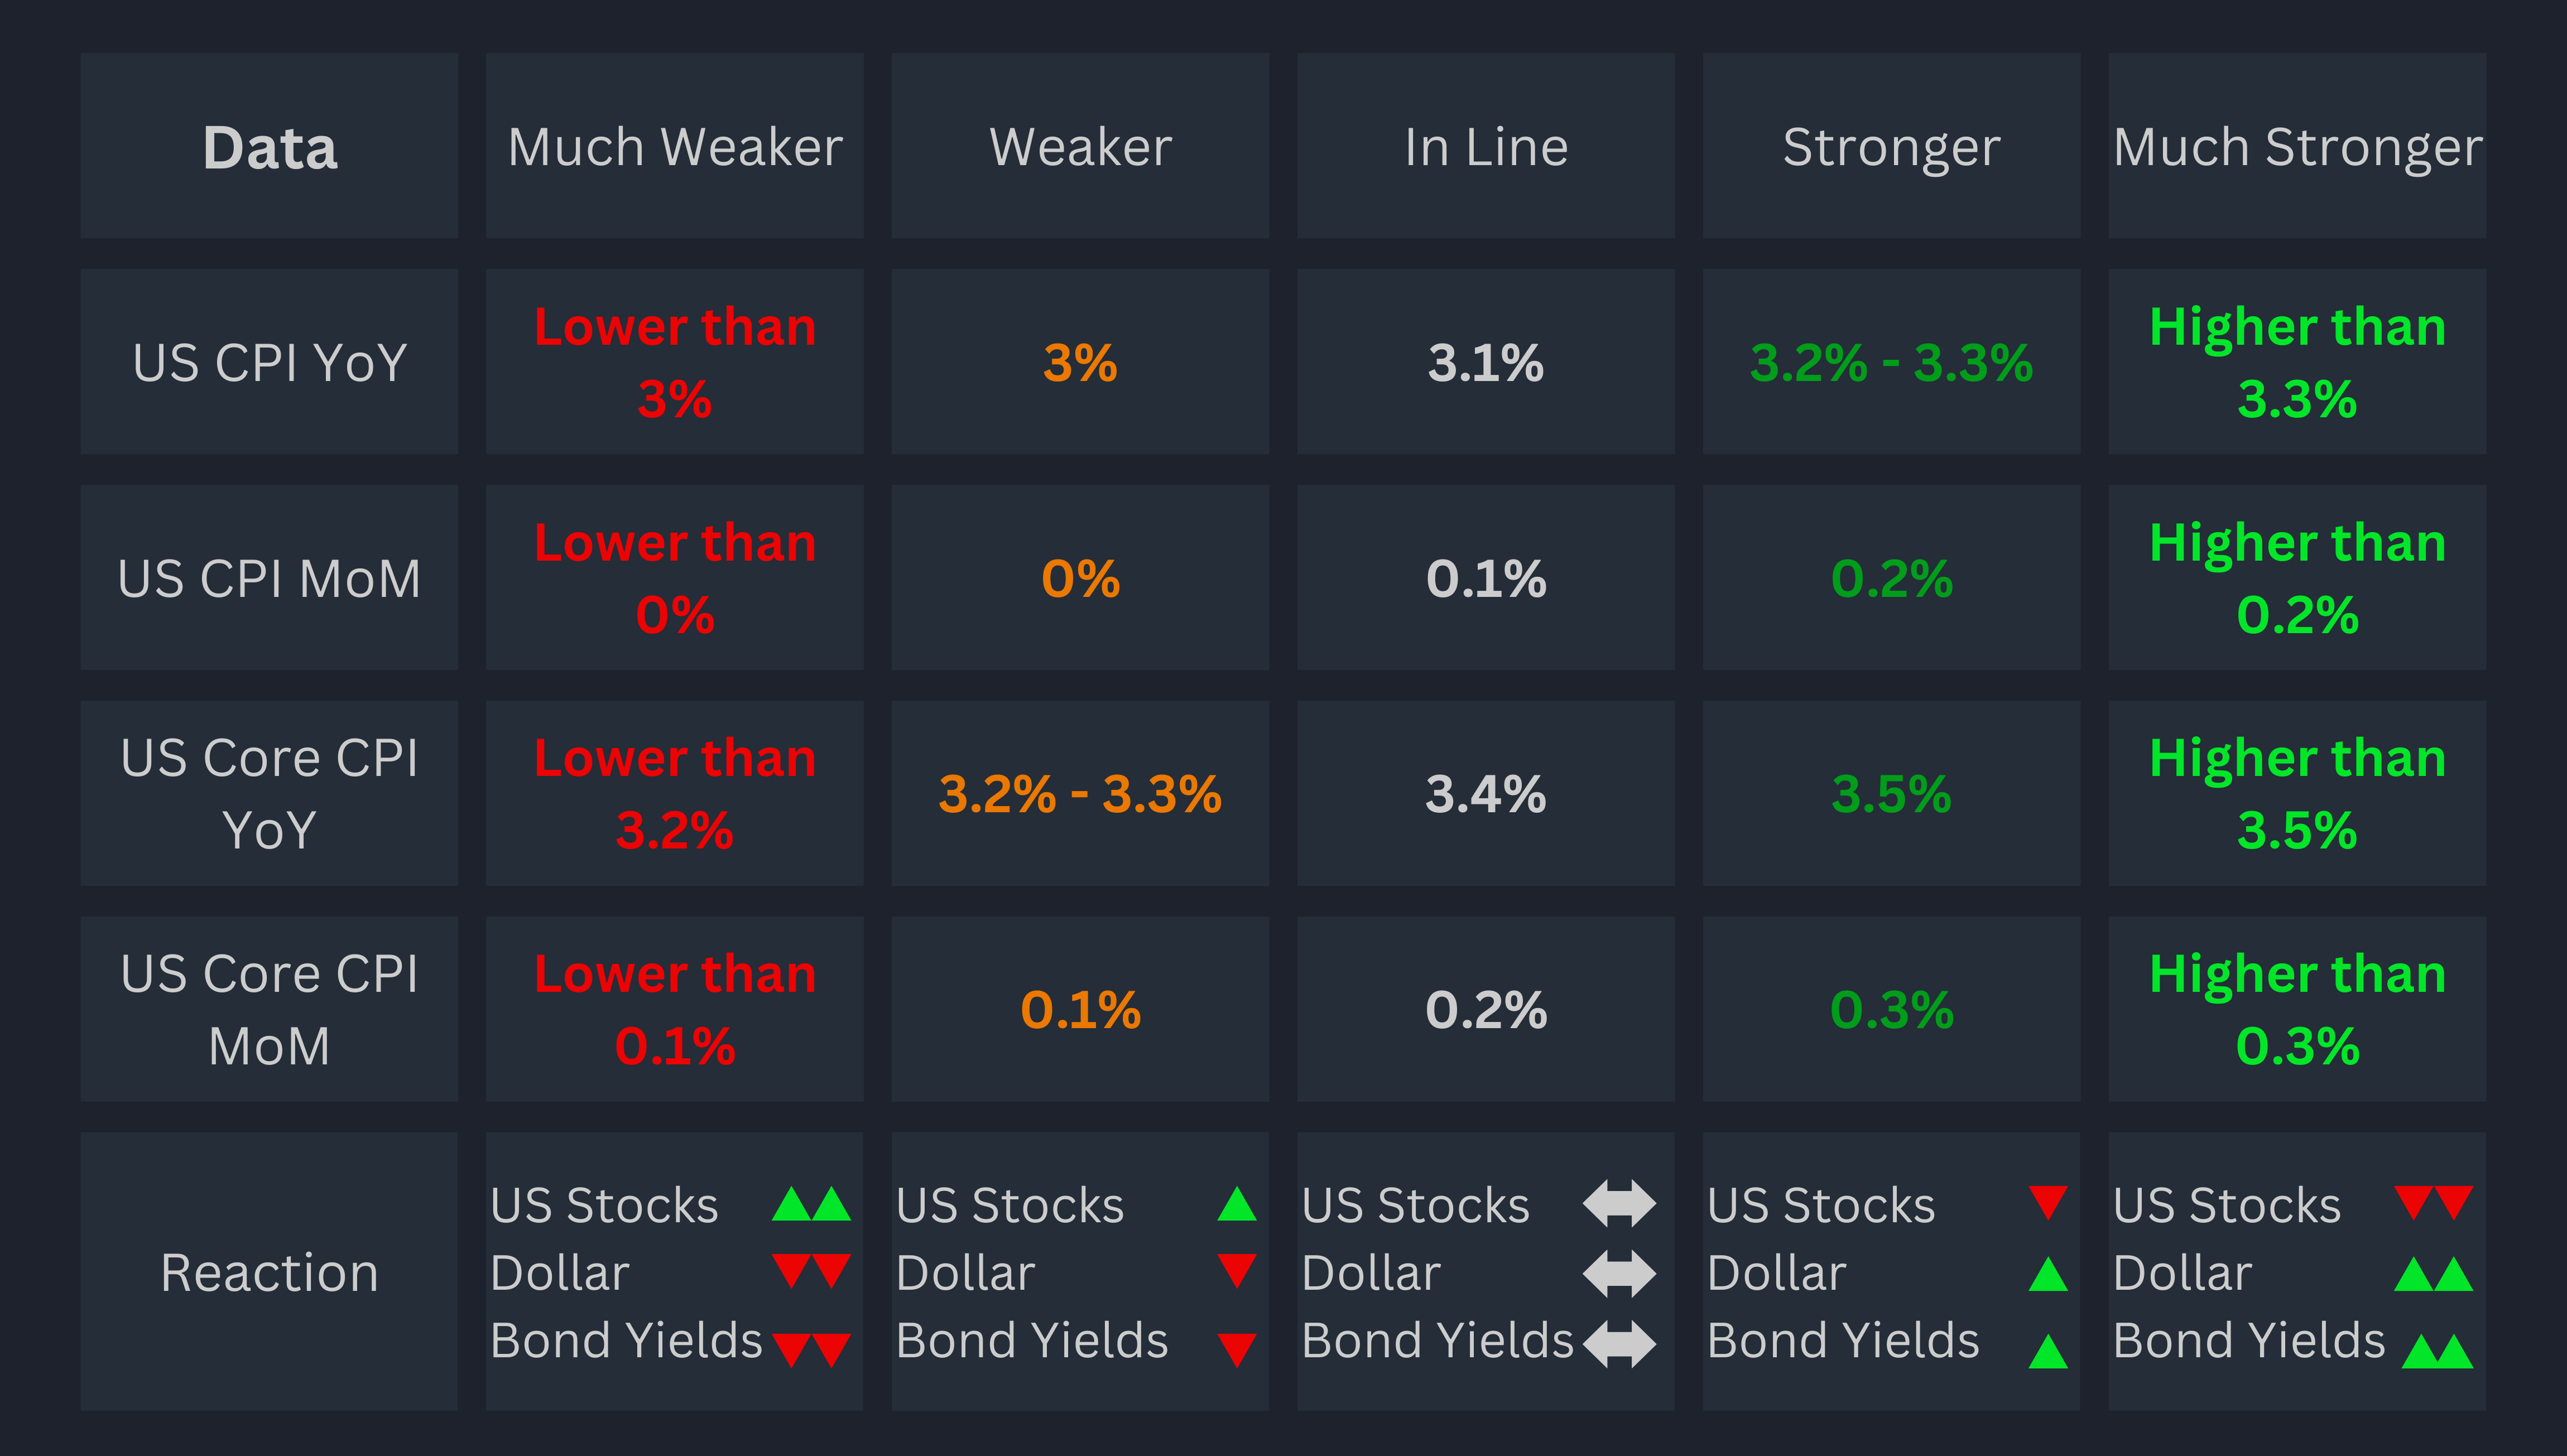
Keep in mind when viewing the above event preview, that the data must be taken in its totality.
If some CPI measures are higher and some are lower, this would be a mixed outcome and could cause volatility before deciding on a particular direction.
In some cases, it balances out to an ‘in line’ outcome if the data is mixed to the up and down-sides equally.
Commentary
Unicredit
We expect headline CPI inflation of only 0.1% MoM in June, which would take the yoy rate down to 3.1% from 3.3%. Core CPI probably rose by another 0.2% MoM, with the YoY rate likely unchanged at 3.4%
The headline index will be weighed down by a 4% MoM fall in gasoline prices, while food-price inflation likely remain contained. Core-goods-price inflation was probably broadly flat again, as the ISM Manufacturing Index’s prices paid sub-index fell back to 52.1 in June from 57.0 in May.
Used- and new-car prices likely fell.
Core-services price inflation remains high but is easing gradually. Housing (43% of the core CPI basket) inflation is easing but it will take time for lower market rents to filter through to average rents. Non-housing core services inflation should continue easing gradually as the labor market softens and as firms find it harder to pass on input price rises to customers.
Bank of America
We expect the June CPI report to be another confidence builder following the undeniably good May report.
We forecast headline CPI rose by 0.1% m/m (0.11% unrounded) owing in part to another drop in energy prices.
This would result in the y/y rate falling a tenth to 3.2% and the NSA index printing at 314.770.
Meanwhile, we expect core CPI increased by 0.2% m/m (0.24% unrounded).
While this is not quite as low as May, it would be a good print for the Fed. (See Exhibit 1 for our detailed forecast table).
Should the CPI report print in line with our expectations, we would maintain our expectation for the Fed to start its cutting cycle in December.
That said, we do acknowledge that another 0.2% m/m print for Core CPI would tilt the risk towards an earlier cut especially given signs of softening activity.
Morgan Stanley
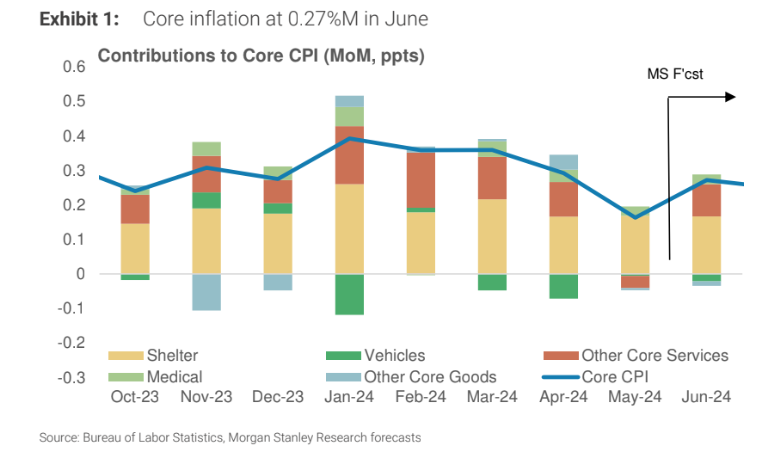
We expect Core CPI inflation at 0.27% (0.2%M consensus, 3.5%Y), higher than May’s weak print but still the second-lowest read this year.
We think a repetition of May’s weak prints in auto insurance and airfares is unlikely and, therefore, we forecast stronger core services ex-housing.
In turn, we see more core goods deflation and gradual progress in rent inflation.
Lower gasoline prices weigh on headline CPI, pushing it below core – we expect headline CPI at 0.13%M (headline CPI NSA index: 314.823). Our CPI forecast implies an increase of 0.23%M for core PCE vs 0.08%M in May.
The PPI data will be released one day later than CPI, on Friday, July 12th, which will help hone our expectation for core PCE inflation.
Core PCE estimates for airfares, medical, and financial services are taken from PPI, and other inputs such as import prices feed into other categories (import prices will be released on July 16th).
JPMorgan
We forecast that the consumer price index (CPI) rose 0.1% in June, with the year-ago inflation rate moving down to 3.1% — a pace last seen in January.
We look for a 0.1% increase in food prices, in line with the relatively soft growth over the past several months, and a -1.2% decline in energy prices (led by a -4% monthly drop in gasoline prices).
Away from food and energy, we look for the core CPI to have risen 0.19% in June. If realized, year-ago core CPI inflation would hold steady at 3.4% after declining by 0.2%-pts in each of the past two months.
Shelter is the largest part of the CPI, and we continue to expect only a gradual easing in the pace of price increases despite much softer readings in some measures of market prices for new rental contracts.
Specifically, we look for a 0.40% rise in owners’ equivalent rent and a 0.36% rise in tenants’ rent in June, which are broadly similar to the pace of monthly increase in each series in recent months.
Elsewhere within the shelter component, industry data point to a third consecutive month of modest decline in lodging prices after seasonally adjusting; we forecast that it declined -0.4% in June.
After an anticipated rebound in May, industry data are once again pointing to a sizable decline in used vehicle prices on the month of -2.0%.
That would be the largest monthly decline since January, and would more than reverse the 0.6% pop in May.
We also anticipate a modest firming in new vehicle prices after declining for five straight months and seven of the last eight; we look for a 0.2% rise in June.
In other transportation-related news, we look for a modest further -0.3% decline in public transportation after this highly volatile series posted an outsized drop the month prior.
One notable source of uncertainty is motor vehicle insurance, which declined unexpectedly in May for the first time in two and a half years.
Wells Fargo
May’s CPI report delivered another welcome piece of evidence that inflation is again subsiding after flaring up to start the year.
Headline CPI was unchanged in the month, the first flat reading since July 2022.
Falling energy prices and a modest increase in food prices helped to keep headline CPI in check.
Core CPI increased by a “low” 0.2%, the smallest increase since August 2021.
Encouragingly, sticky services inflation finally showed signs of easing, thanks in large part to declines for airfares, motor vehicle insurance and lodging away from home.
We anticipate the headline CPI ticked up 0.1% in June, amounting to a 3.1% year-to-year increase.
Energy prices again look set to be a drag on the headline, while food prices should continue to moderate.
Although core goods prices are tracking for another monthly decline, a rebound in core services excluding housing prices looks set to drive a firmer reading on the core CPI.
As such, we look for a 0.2% monthly rise in the core CPI, bringing the annual change to 3.5%.

Previous Release
On June 12th at 08:30 ET, the BLS released the US CPI numbers for the month of May.
CPI YoY came in at 3.3%, lower than the expected 3.4%, and down from the previous 3.4%.
CPI MoM cooled off as well, to a flat 0%, on expectations of 0.1%, and down from the prior 0.3%.
Core CPI YoY came in at 3.4%, lower than the expected 3.5%, and lower than the previous 3.6%
Core CPI MoM cooled down to 0.2%, on forecasts of 0.3%, and the prior of 0.3%.
Across the board, all measures of US CPI came in lower than expected overall for the month of May.
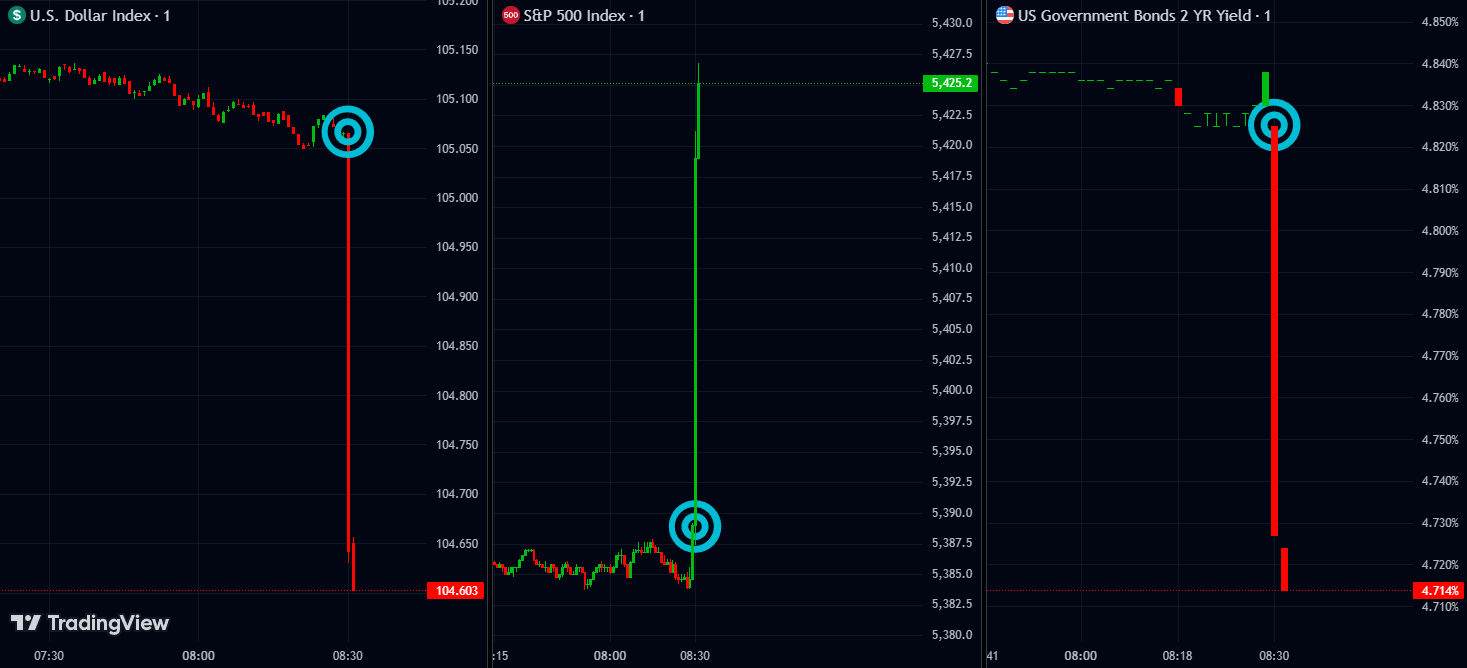
This broad cooling off in US inflation settled fears regarding sticky inflation, and pushed forward bets on Fed rate cuts this year, increasing the chance of a cut in September.
This subsequent repricing caused weakness in the dollar and US treasury bond yields, and strength in US stocks, as pictured. (1M chart at the time of release)


